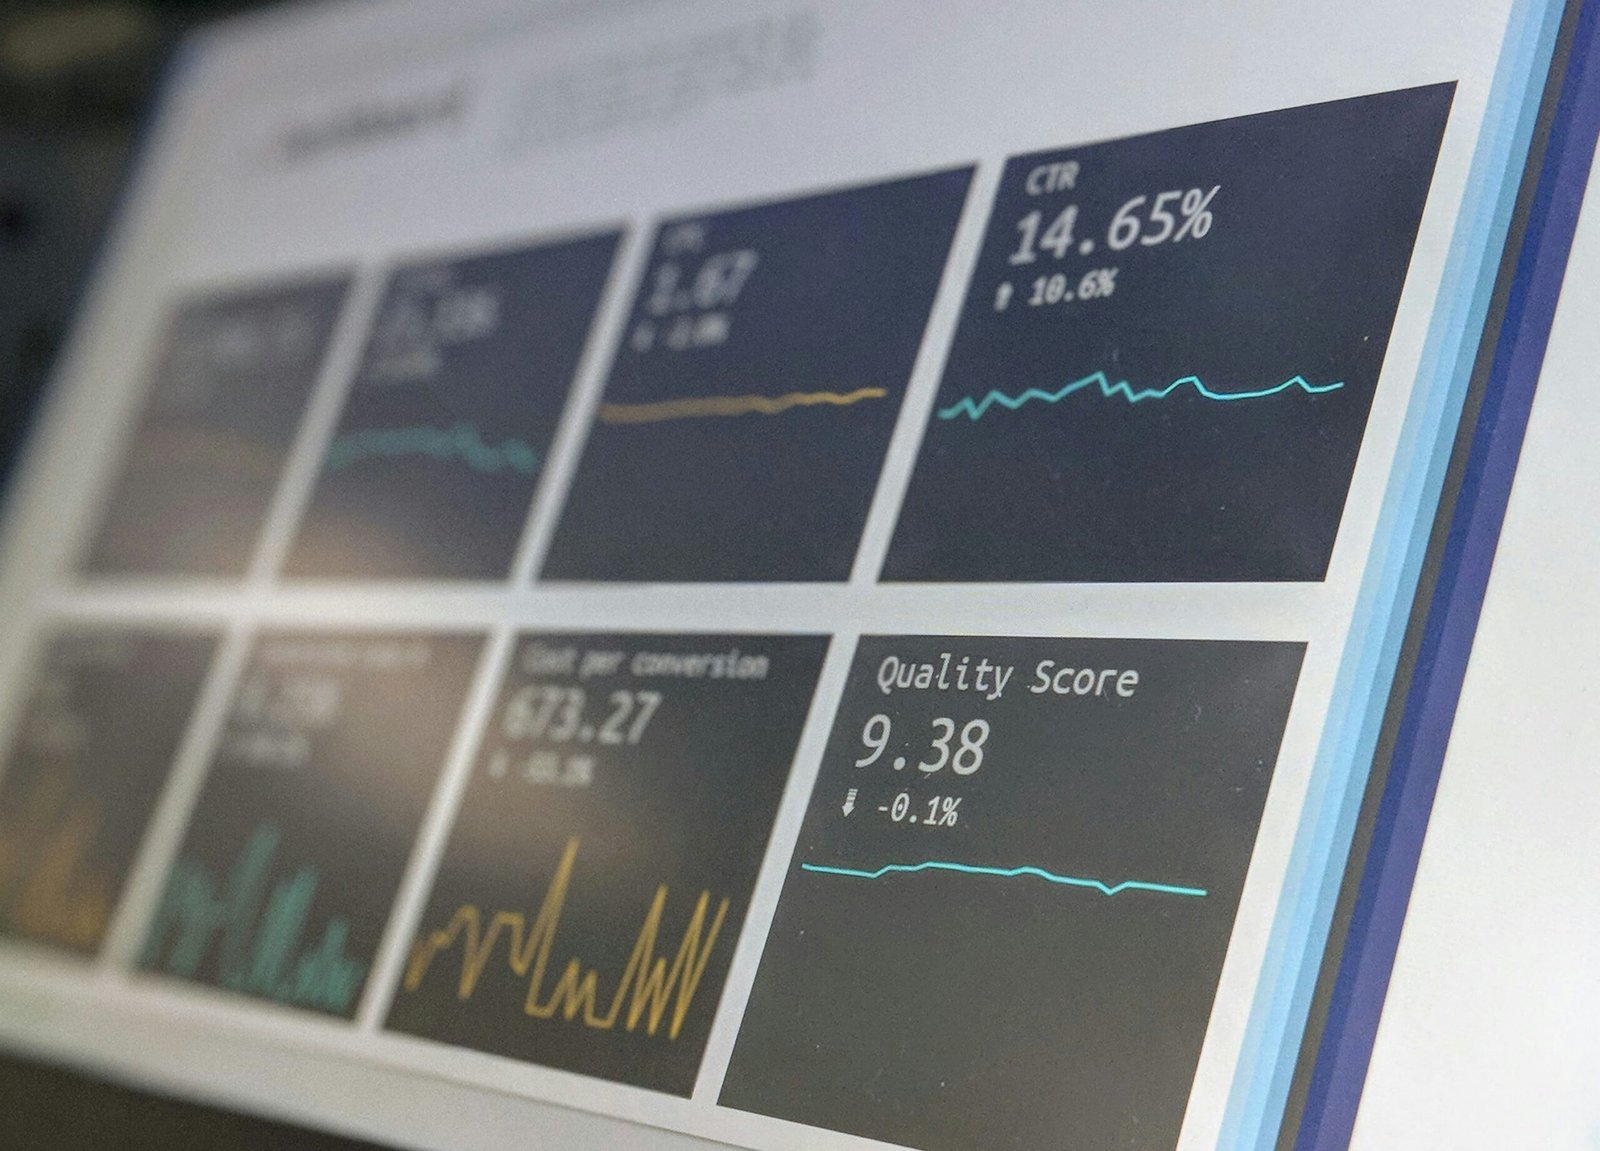
Introduction to AI in Data Visualization
Data visualization plays a crucial role in translating complex datasets into comprehensible formats, making it easier for IT professionals to interpret and derive actionable insights. Integrating Artificial Intelligence (AI) with data visualization represents a significant advancement in this field, transforming the way data is processed and presented. Traditional data visualization methods often rely heavily on predefined models and static charts. While these methods are beneficial, they can be limited in ability to adapt to the dynamic nature of data generated in the IT sector.
AI introduces a layer of intelligence and flexibility to data visualization by enabling systems to learn from data patterns and make autonomous decisions. This capability allows for the creation of more intuitive and interactive visual representations, which can adjust in real time as new data emerges. AI-powered tools can handle vast amounts of data with greater speed and precision, identifying trends and outliers that might be overlooked by conventional methods. For IT professionals, this means enhanced efficiency and accuracy in data interpretation, leading to more informed decision-making processes.
The integration of AI in data visualization is not just about improving the aesthetics of data representations; it fundamentally changes how data insights are generated and consumed. As AI algorithms become more sophisticated, they can offer predictive analytics and advanced anomaly detection, thus providing deeper insights into data trends and potential issues before they escalate. This proactive approach is invaluable in the fast-paced IT landscape, where staying ahead of potential problems is critical.
Moreover, AI-driven data visualization tools can customize visual outputs based on the specific needs of users, enhancing the overall user experience. This customization ensures that different stakeholders, from data analysts to business leaders, receive tailored insights that are relevant to their roles and objectives. Consequently, the collaboration between AI and data visualization is opening up new avenues for innovation, making it an indispensable asset for IT professionals looking to harness the full potential of their data.
Key AI Techniques Transforming Data Visualization
Artificial Intelligence (AI) is revolutionizing data visualization by incorporating techniques that make complex datasets more comprehensible and actionable. One of the primary techniques is the application of machine learning algorithms. These algorithms can process vast amounts of data, identifying trends and anomalies that may be invisible in traditional data analysis. For instance, clustering algorithms can group similar data points, providing clear visual segments that are easier to analyze. Decision trees and neural networks can also be employed to predict outcomes, enhancing the depth of data insights.
Another significant AI technique is Natural Language Processing (NLP). NLP enables data visualization tools to understand and interact using human language. This transformative capability allows users to query data sets in plain English, receiving visual representations as responses. A practical example includes text analytics, where NLP can sift through large volumes of unstructured text data to extract essential information, subsequently visualized through word clouds or sentiment graphs.
Predictive analytics is another critical AI-driven method enhancing data visualization. By applying predictive models, we can generate forecasts based on current and historical data trends. Visual tools integrate these models to create dynamic dashboards displaying future scenarios, helping businesses preempt potential challenges. For instance, a predictive model might analyze market trends, allowing companies to visualize potential sales growth or declines, thus supporting strategic decision-making.
These AI techniques collectively simplify complex data sets, making it easier to derive meaningful insights. By highlighting patterns that might not be immediately evident, AI ensures that data visualization is not just about displaying data, but about revealing deeper narratives within the data. Techniques such as these enable more interactive and informative visualizations, ultimately leading to better-informed decisions and more effective strategies.
Benefits of AI-Enhanced Data Visualizations in IT
Integrating AI in data visualization within the IT sector offers numerous tangible benefits, fundamentally transforming how information is processed and utilized. One of the primary advantages is the significant enhancement in accuracy. Traditional methods of data visualization often rely on manual data entry and static charts, which can be prone to human error and misinterpretation. However, AI-driven tools leverage machine learning algorithms and advanced analytics to sift through massive datasets with precision, ensuring a higher degree of accuracy and reliability.
Efficiency is another critical aspect that is markedly improved through AI. By automating the data analysis process, AI reduces the time it takes to generate insightful visualizations. Real-time data analysis becomes feasible, allowing IT professionals to make prompt, informed decisions without delays. This efficiency can be particularly beneficial in scenarios such as network monitoring and cybersecurity, where timely responses are crucial.
AI-enhanced data visualizations also deepen the level of insights that can be obtained. Predictive capabilities provided by AI empower IT teams to foresee potential issues and opportunities before they materialize. For instance, predictive maintenance in IT infrastructure can preempt system failures, minimizing downtime and reducing operational costs.
Furthermore, the decision-making process within IT projects is significantly sharpened through AI-driven visualizations. By consolidating vast amounts of data into comprehensible visual formats, AI allows leaders to grasp complex information rapidly and make data-driven decisions. Enhanced decision-making is showcased in various real-world applications. For example, in a case study involving a large Retail Bank, AI-powered dashboards provided comprehensive insights into customer behavior, enabling the IT team to optimize their backend systems and improve user experience, which led to a 20% increase in customer satisfaction.
Similarly, an IT service provider using AI-driven data visualization tools managed to predict and mitigate server overloads, ensuring uninterrupted service delivery. These examples highlight how AI enhances the accuracy, efficiency, and depth of insights in IT data visualization, driving better outcomes and fostering innovation.
Future Trends and Challenges
As the landscape of AI in IT data visualization evolves, several emerging trends signify the advancement of this technology. One prominent trend is the integration of augmented reality (AR) to enhance user interaction. AR has the potential to transform data visualization by overlaying digital information onto the physical world, making data more accessible and intuitive to interpret. By employing AR, organizations can provide a rich, immersive experience that enables users to understand complex datasets in new and innovative ways.
Another key trend is the increasing role of big data in shaping AI algorithms. As datasets continue to grow in volume and complexity, AI systems must adapt by developing more sophisticated algorithms to process and analyze this information effectively. This progression will lead to more accurate and actionable insights, directly benefiting decision-makers across various industries.
However, these advancements come with several challenges. Data privacy remains a significant concern, as the collection and analysis of vast amounts of sensitive information raise questions about security and ethical usage. Ensuring robust data protection measures and complying with evolving regulations will be critical to maintaining trust and integrity in AI-driven data visualization.
Moreover, the need for advanced skills to interpret AI-generated insights poses another challenge. As AI systems become more complex, there will be a growing demand for professionals who possess both technical expertise and domain-specific knowledge. Investing in education and training programs will be essential to bridge this skills gap and empower users to make informed decisions based on AI-driven data visualization.
Lastly, the potential for over-reliance on AI without human oversight is a concern. While AI can significantly enhance data interpretation, it is not infallible. Human judgement remains indispensable to validate AI-generated insights and ensure that decisions are made with a comprehensive understanding of the context. To address this, organizations should foster a collaborative approach where humans and AI work together, combining their strengths to deliver optimal results.
By embracing these trends and proactively addressing the challenges, organizations can harness the full potential of AI-driven data visualization, paving the way for a future where data is not just seen, but truly understood.


